


EMC Chart of North America
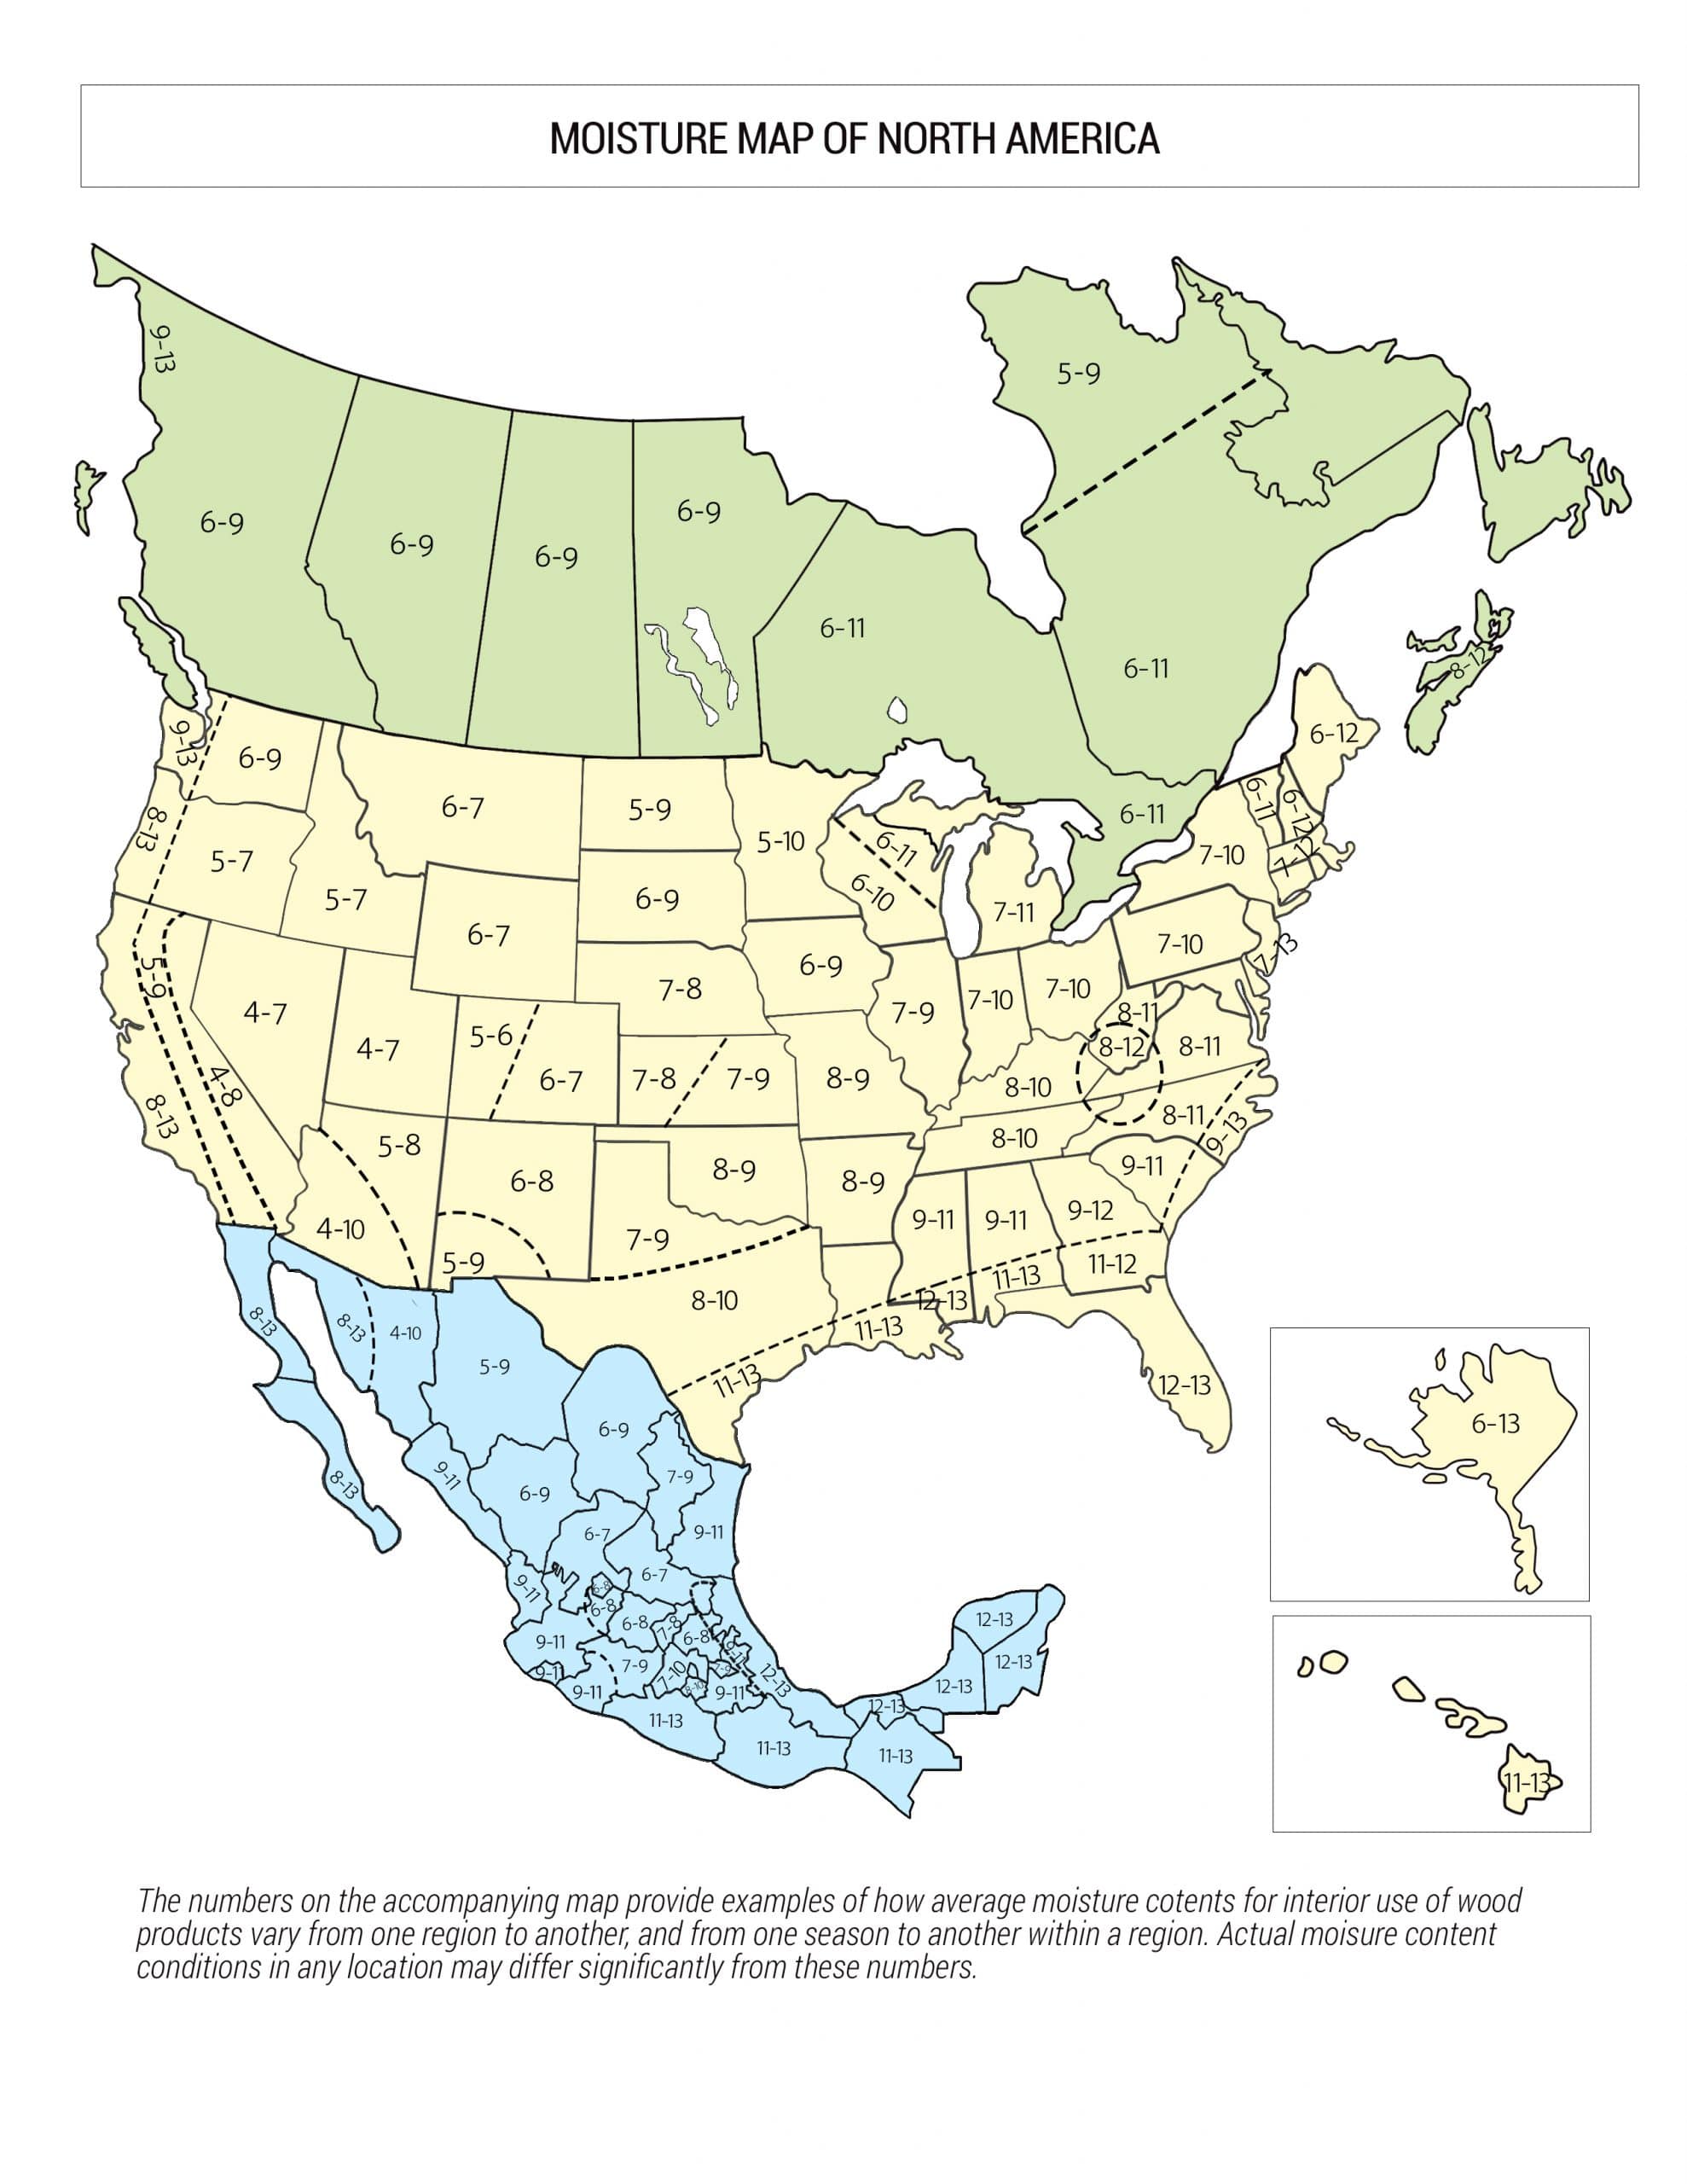
Image from NWFA. Reproduced with permission.
Here is an EMC chart of North America. This map shows the average moisture content percentages around North America for interior use of wood. Use this map to help you determine the wood’s average moisture content in your area.
** The numbers on the accompanying map provide examples of how average moisture contents for interior use of wood products vary from one region to another and from one season to another within a region. Actual moisture content conditions in any location may differ significantly from these numbers.
Learn all about what EMC is and the formula in our guide.
Last updated on December 4th, 2025

 800-634-9961

