




How to Use the Wagner Sentry App
Wagner Sentry® is a free smartphone app that controls and downloads stored data from Wagner Meters’ wireless relative humidity and temperature data loggers. The app connects via Bluetooth® to the Floor Sentry® embedded wood floor data logger and to the Smart Logger™ V2.
IMPORTANT: These devices can be connected to only one mobile device at a time.

How to Use the Wagner Sentry App, Step by Step
Step 1
Download the Wagner Sentry app for free from the Apple App Store or Google Play.
Step 2
For iOS users:
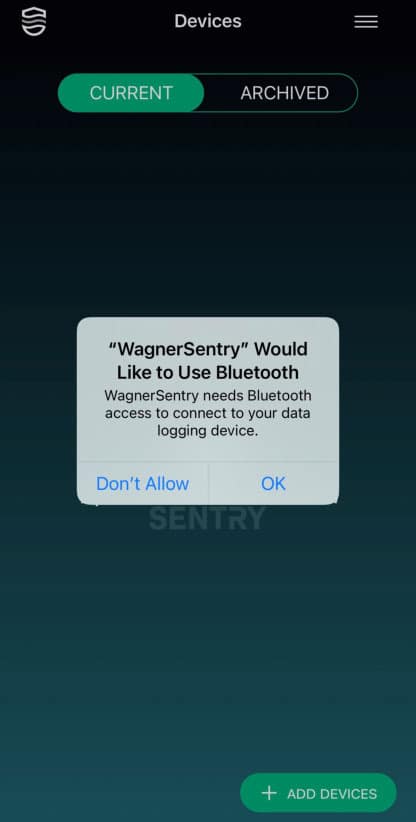
Open the app and select “OK” when prompted to allow Bluetooth. The Wagner Sentry app requires Bluetooth to connect to devices within range.
Step 3
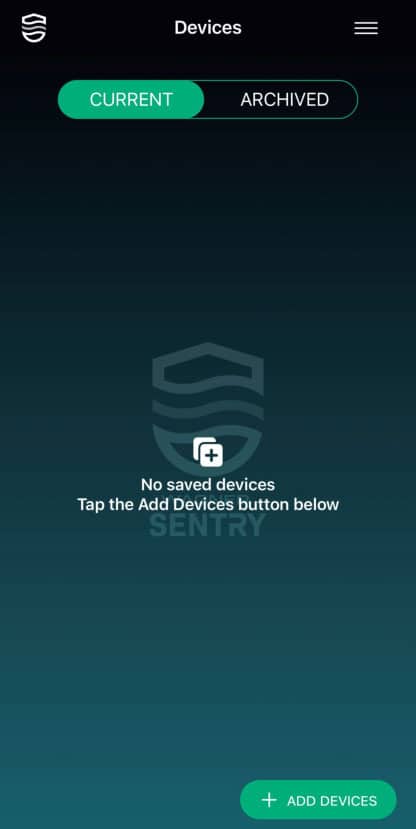
You should see the Devices screen. Select the “+ Add Devices” button to start adding a new device.
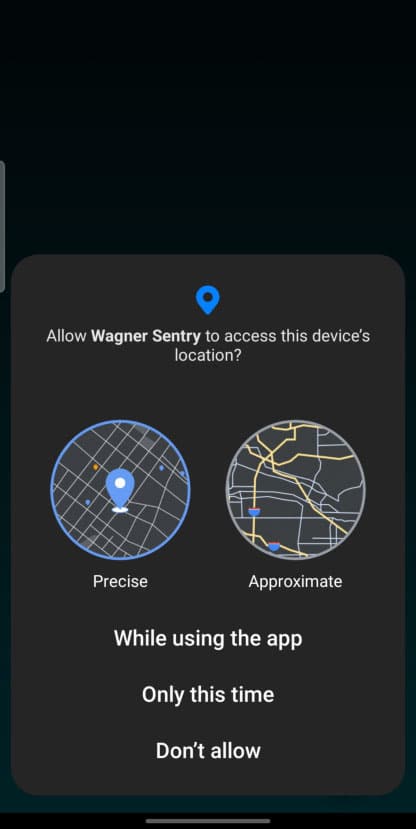
For Android users, a pop-up for location settings will display. Select “While using the app.” You must enable this to receive alarm notifications from your data logging device(s) when the app is not running.
Step 3 Continued
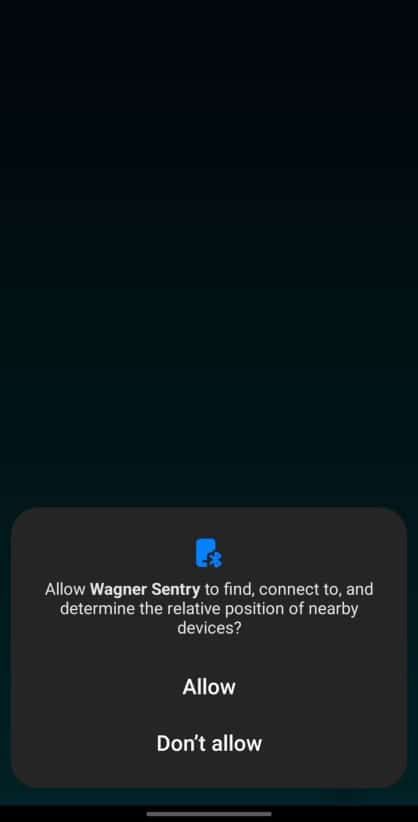
Next, a pop-up message requesting Bluetooth access will display. Select “Allow” to grant access.
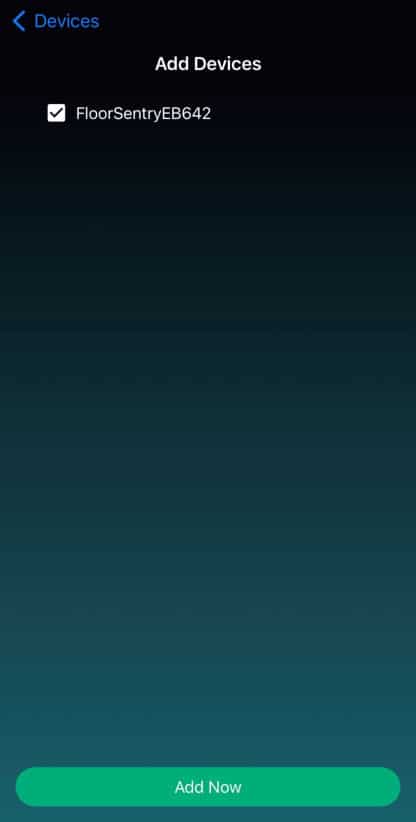
This takes you to the Add Devices screen, which displays all devices within Bluetooth range. Select the device(s) you want to add, then click “Add Now” to finish and go back to the Devices screen.
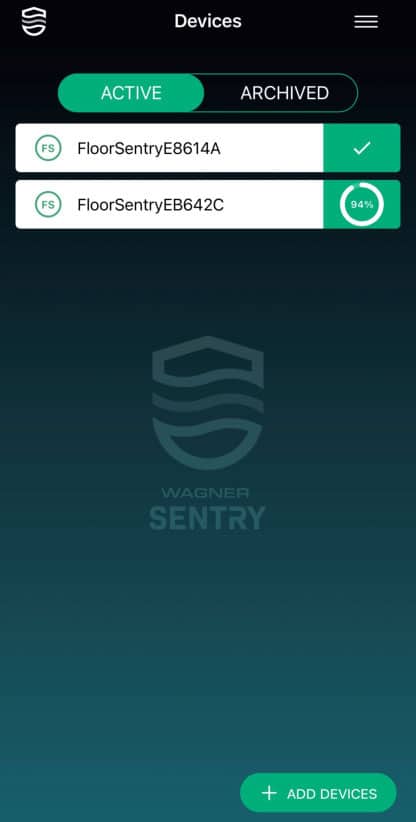
The app will automatically sync all of the information and display a check mark to the right of the device name when it’s complete.
Step 4
To access current data or change device settings, select a device.
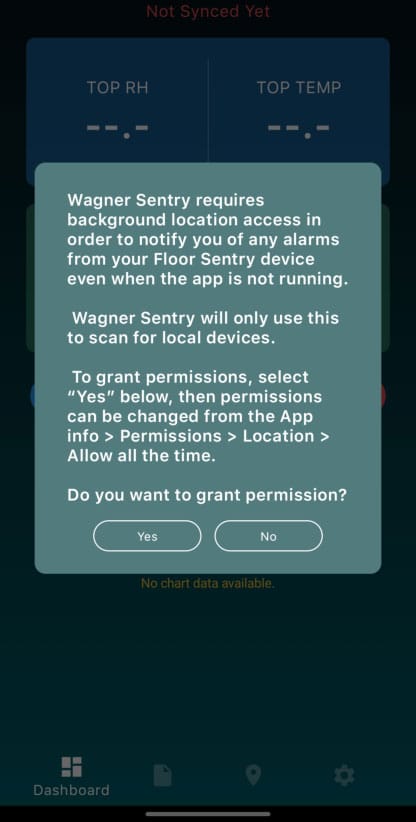
For Android users: If this is the first time using the app, select “Yes” on the pop-up to grant background location permissions.
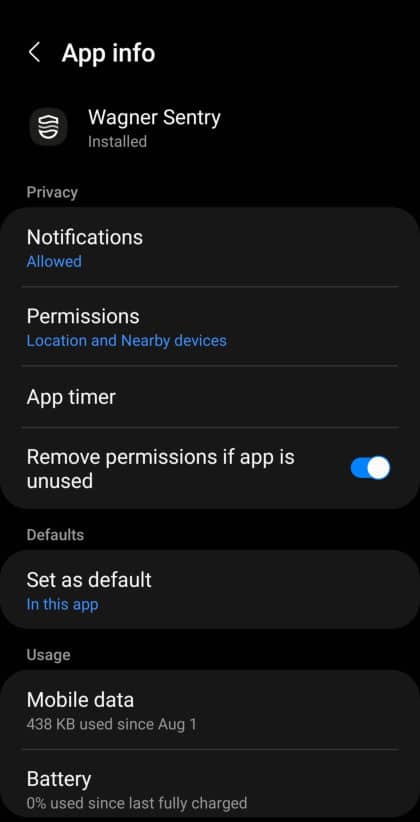
This takes you to an app info screen in your phone settings. On this screen, select “Permissions” > “Location” > “Allow all the time.” Once permissions have been granted, select the back arrow until you return to the Wagner Sentry app.
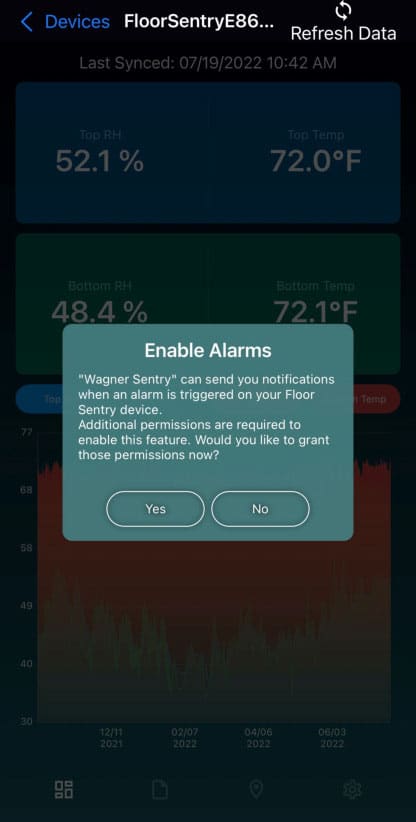
For iOS users: If this is the first time using the app, select “Yes” on the pop-up to enable alarms. Then select “Allow” to allow notifications for the alarms you’ll set up later.
Step 4 Continued
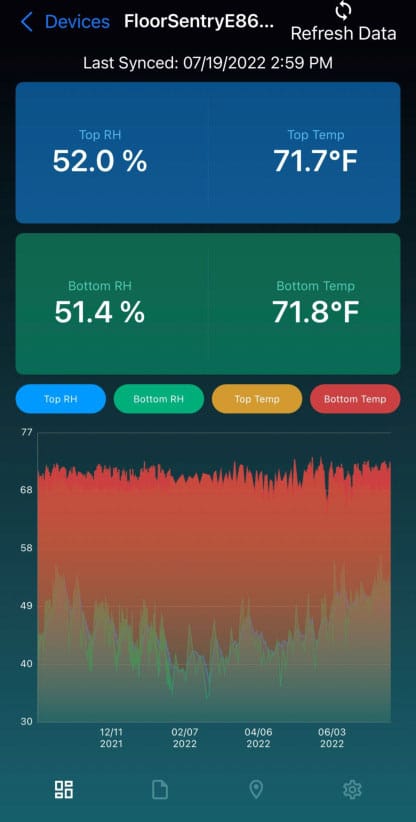
This takes you to the Data Summary screen. At the top of the screen is a default device name, which you can change (explained in Step 7). Below it are the date and time the device was last synced with the app. The date displays in red if it is not a current reading (unless the device settings have been changed by another phone or it has been more than 24 hours since the last reading). Select “Refresh Data” in the top-right corner to sync and get current readings.
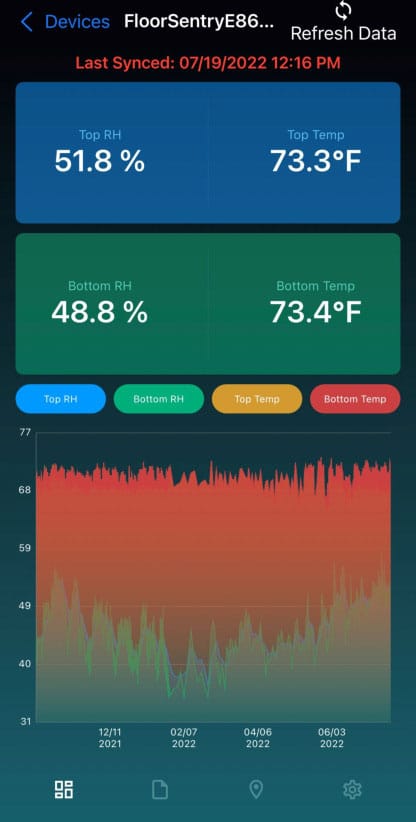
Next, you’ll see the last synced temperature and RH readings. You can display graphs for the RH and/or temperature data by toggling the parameters you want.
(Note: The colors in the graph match the toggle buttons above it.) Pinch to zoom in or out on the graph. Use the buttons on the app bar at the bottom of the screen to move between the four data and device setting screens.
Step 5
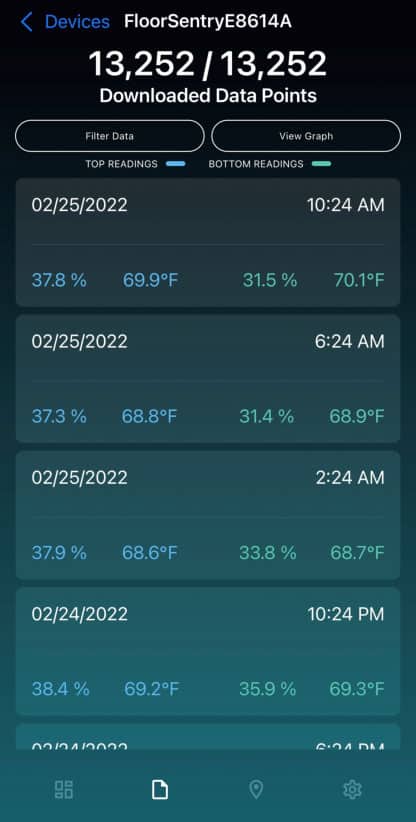
Select the second icon ( ) at the bottom to go to the Data screen, where you can filter data by date range. Filtering changes the list of data points shown and lets you view the filtered data as a graph when you select “View Graph.”
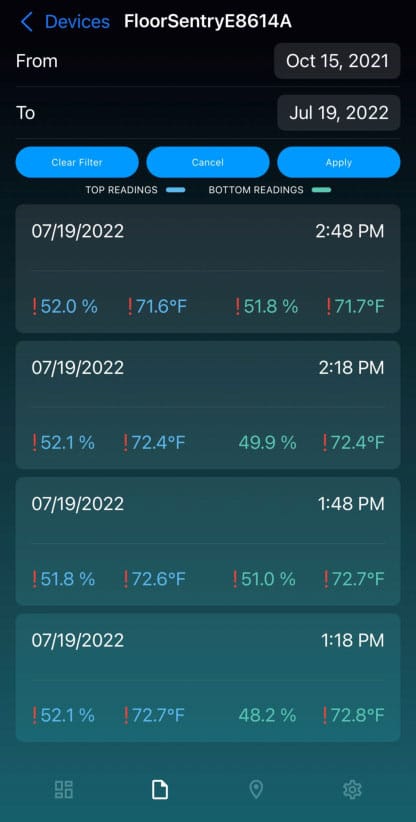
Clear your filter at any time by selecting “Clear Filter.”
Step 6
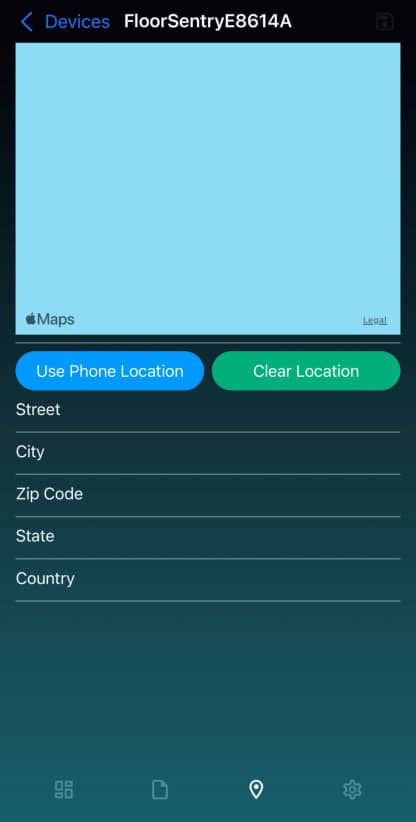
Select the third icon ( ) at the bottom to go to the Location screen. You can set the device’s location in two ways: use your phone’s location or enter the street address.
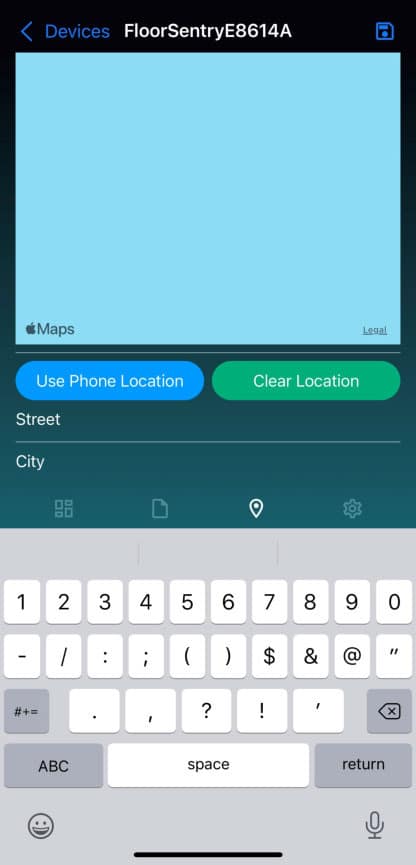
After entering an address, click the “Save” icon in the top-right corner of the screen.
Step 7
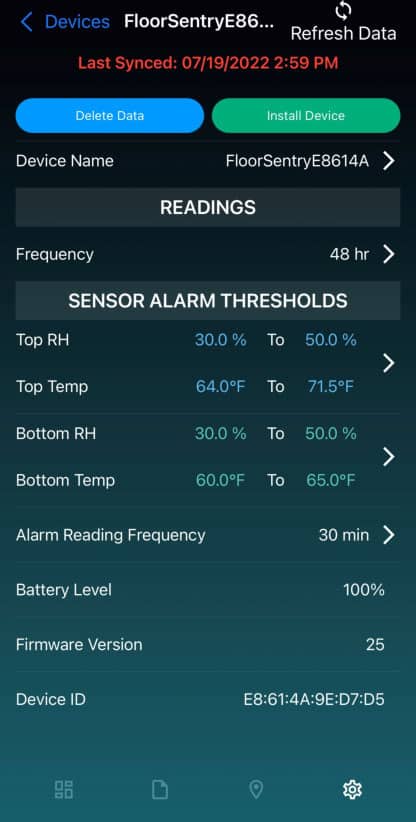
Select the fourth icon ( ) at the bottom to go to the Device Settings screen. If you’re using your device for the first time, you can rename it here.
On the Device Settings screen, you can also:
- Re-sync your data by selecting the “Refresh Data” icon at the top right of the screen
- Set how often readings are taken
- Set the top and bottom sensor alarm threshold ranges for both temperature and RH
- Set the “Alarm Reading Frequency” (how often readings are taken once the device is in an alarm state)
- IMPORTANT for Floor Sentry devices only: After completing the installation instructions on pages 1 to 2 of the manual, click “Install Device.” This clears any existing data so the device stores only data collected after installation.
- IMPORTANT for Smart Logger devices (V1 and V2): The Smart Logger has a password feature, which can be set from the “Device Settings” menu. Once a password has been set, you’ll be prompted to enter it every time you try to change that device’s settings.
Note: You can still sync a Smart Logger V2 and view its data without entering the password. For the Smart Logger V1, the password must be entered to sync and view the data.
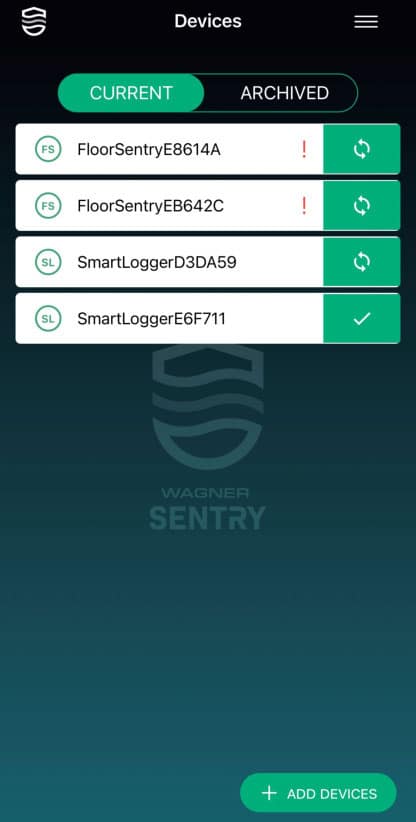
On the main Devices screen, the (FS) or (SL) to the left of the device name shows whether the device is a Floor Sentry or a Smart Logger.
A red exclamation point (!) to the right of a device name means one or more alarm thresholds have been crossed.
Note: The device checks its sensor(s) every 15 minutes and triggers alarms if needed. These checks aren’t saved to memory unless they trigger an alarm; the device records data only at the reading frequency you set.
The white-on-green refresh icon ( ) means there is new data on the device to sync. Press it to re-sync the app with the device.
The white-on-green check mark icon ( ) means the data from the device is current and doesn’t need to be synced. Note: This is accurate only if the phone has the latest device settings.
Note: The default sensor alarm thresholds are 30% to 50% RH and 60°F to 80°F.
Saving: After you change the sensor alarm thresholds or the reading frequency, a “Save” icon ( ) replaces the “Refresh Data” icon in the top-right corner. Click it to save your changes.
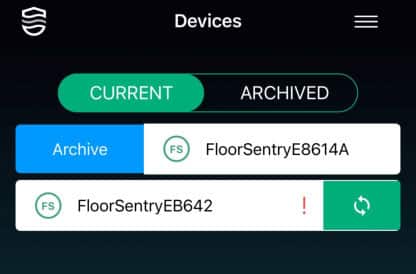
To store a device for later, use the “Archive” function by sliding the device’s bar to the right (iOS) or using a long press (Android).
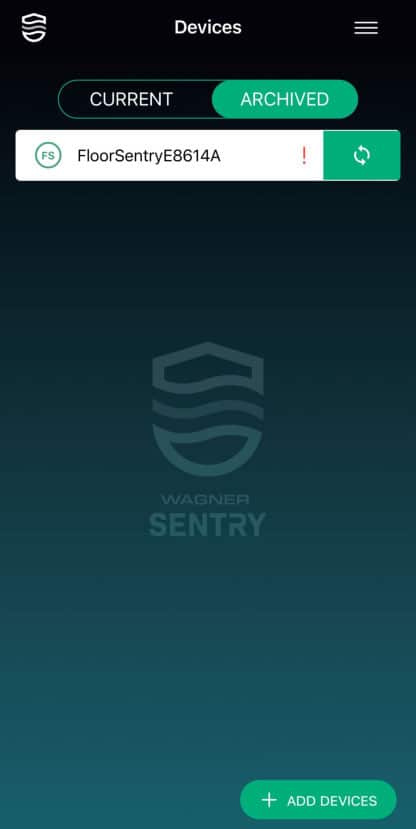
To access an archived device later, touch “Archived” to view, edit, or restore it to “Current” status.
On the “Archived” screen, you can restore a device to your current “Devices” list by sliding its bar to the right (iOS) or using a long press (Android).

Devices Menu Explanation
The menu icon at the top right of the Devices screen (three horizontal bars) is your general navigation tool. Touch it to open a pop-up menu with three options: “Generate Report,” “Settings,” and “Help.”
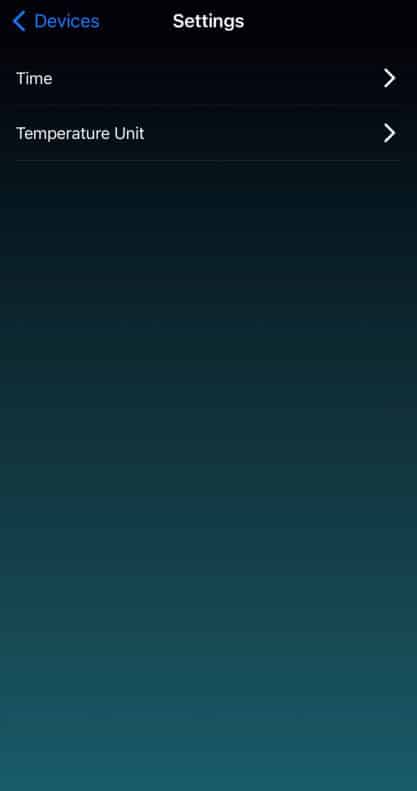
Settings
Open the main menu and select “Settings.” Here you can choose 24-hour time and/or metric units. The defaults follow your phone’s settings.
Help
Open the main menu and select “Help” to watch a short video version of these instructions.
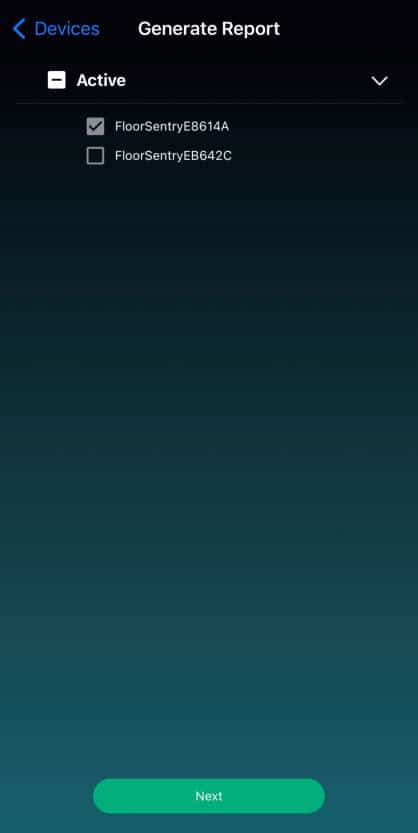
Generate Report
To generate a PDF report you can send to a client and to yourself (always recommended), select the menu in the upper-right corner. Then select “Generate Report,” choose the device(s) you want to include, and select “Next.”
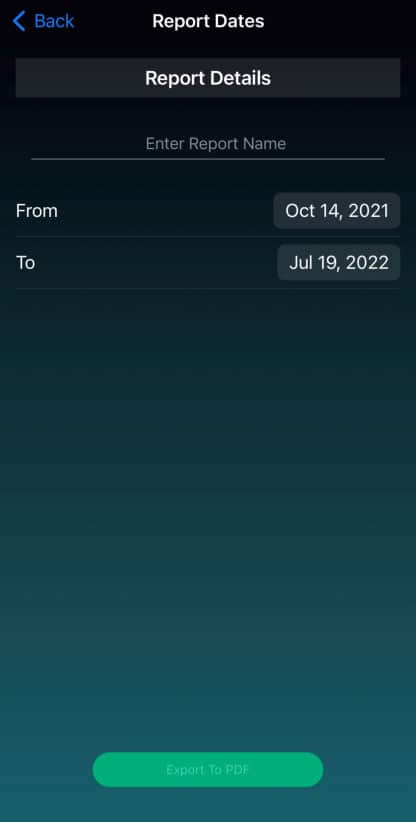
Enter a report name (required) and select the date range you want to include. Then select “Export To PDF.”
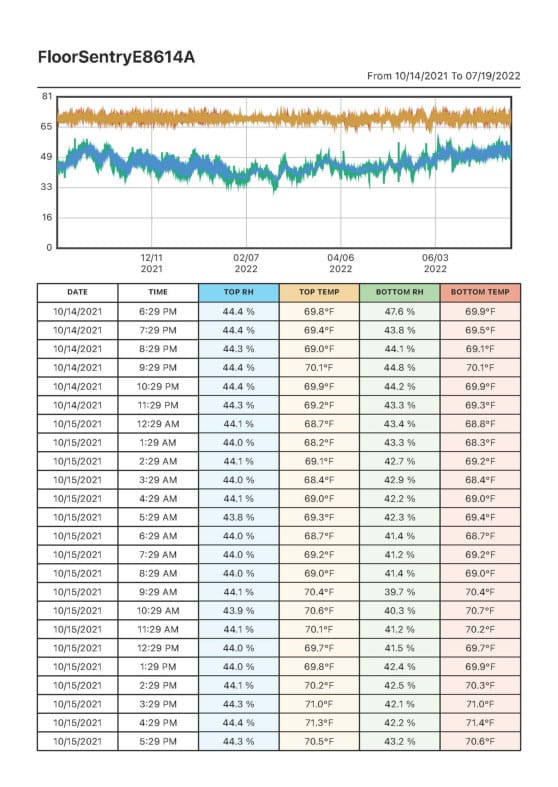
Sample PDF Report for Floor Sentry
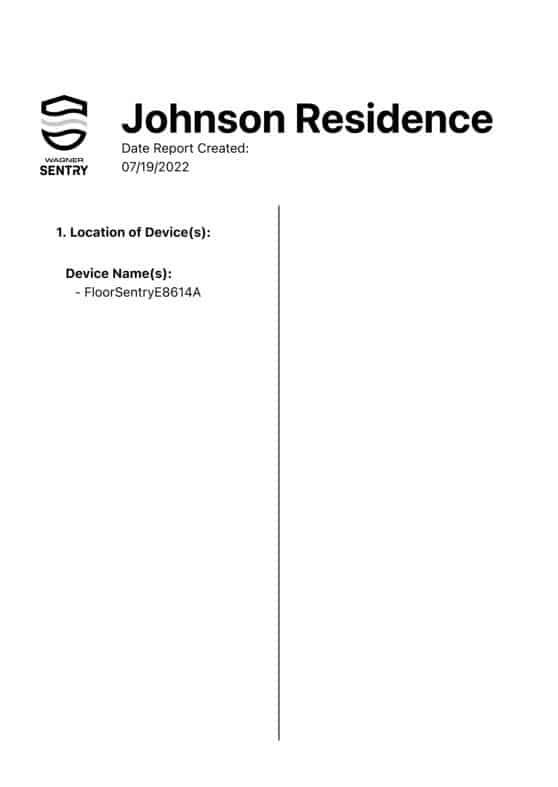
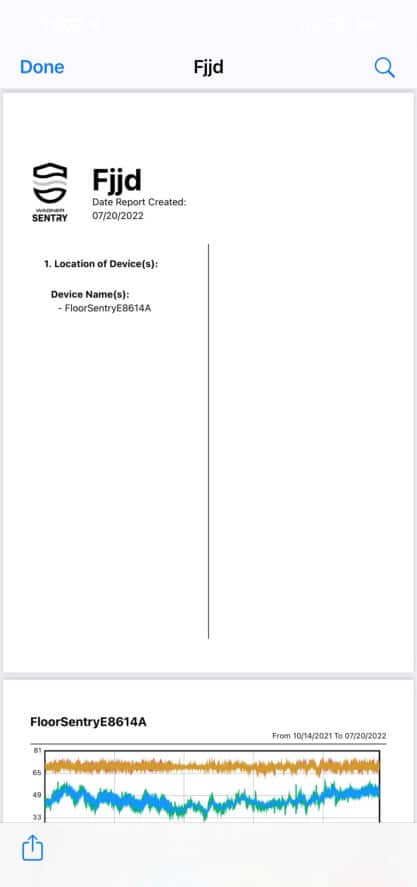
For iOS devices, select the Share icon in the lower-left corner, then select the app you want to use to email the report.
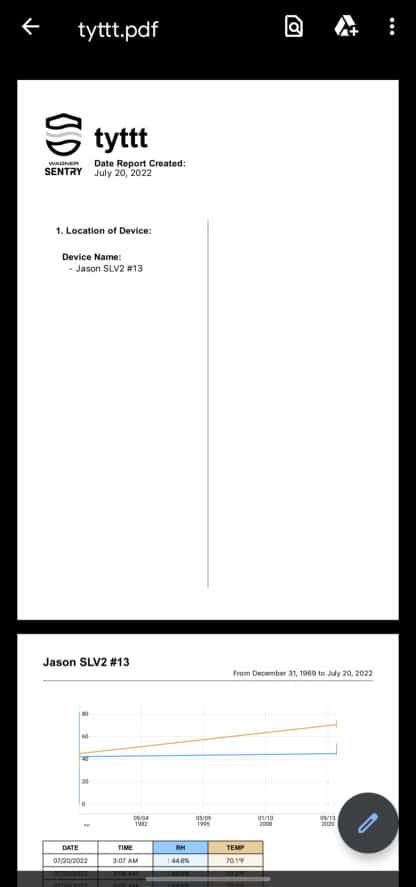
For Android devices, select the three dots in the top-right corner to email the PDF report.

 800-634-9961


